I spend a lot of time thinking about the sustainability of open source projects and the role that contributor sustainability plays in overall project sustainability. This involves more than just attracting contributors, but in ensuring they stay, grow, and thrive within our open source projects, and that can be a lot easier if we think outside of our traditional boxes and get creative about recruiting and retaining contributors.
Within the CHAOSS project, some of our most successful initiatives are driven mostly or partly by folks from our CHAOSS Africa chapter. We also have a CHAOSS Asia chapter that has recently re-started and is also driving some interesting work within the project. As a result, I’ve seen first hand some of the challenges, but also the rewards, that come from making it easier for people to contribute from countries that haven’t always been well-represented in many open source projects.
On a similar note, until recently, I was co-chair of the CNCF Contributor Strategy Technical Advisory Group where we were working to help CNCF projects grow their contributor bases. The CNCF mentoring programs were managed out of this group, and I was struck by how many mentees stick around after their time in the program with some mentees even becoming mentors! Another initiative within this group was the Deaf and Hard-of-hearing Working Group where I was inspired by all of the amazing work to help folks more actively participate in CNCF events and projects! This work was so successful that a second group was created by people from the blind and visually impaired community with similar goals of making it easier for people to participate.
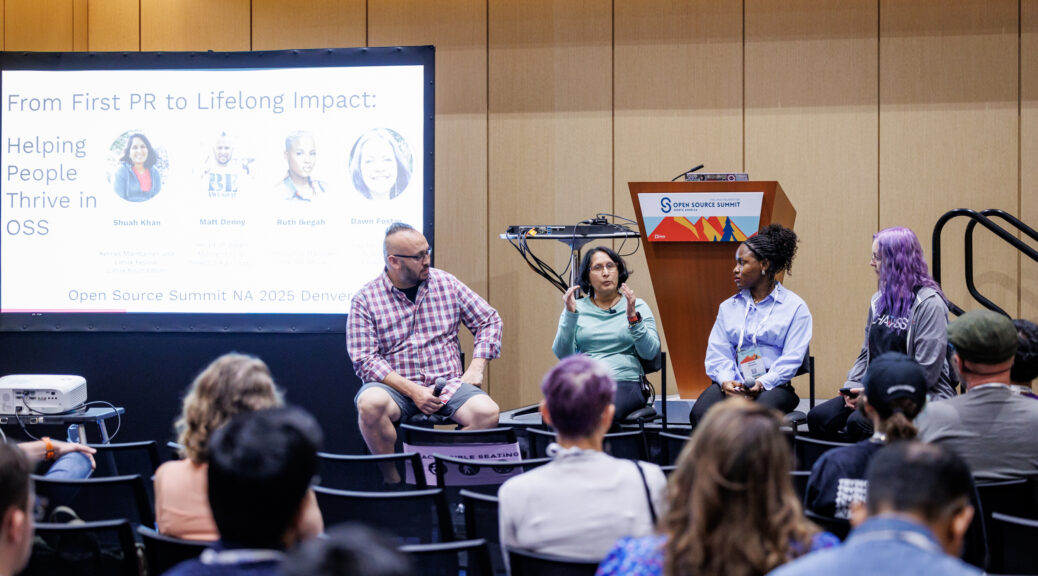
All of this work got me thinking about how traditional pathways into open source don’t work for everyone and that we need to expand our contributor pipelines beyond the usual audiences if we want to have more sustainable open source projects where everyone can feel comfortable participating. This was the idea behind bringing together a panel of experts at the recent Open Source Summit in Denver where I led a panel discussion about this topic with Shuah Khan, Ruth Ikegah, and Matt Denny. I hope you enjoy this video of our discussion!
Note: A huge thank you to Sandeep Kanabar who helped put this proposal together, but was unable to attend at the last minute, and thanks again to Matt for stepping in on short notice!
If you want feedback or help with how to grow your contributor base or improve your open source strategy, I’m available for consulting engagements.
Resources and Links:
- Spotlight on CNCF Deaf and Hard-of-hearing Working Group (DHHWG)
- CNCF Blind and Visually Impaired Group & Deaf and Hard of Hearing Group
- CHAOSScon Africa and CHAOSS Africa Meetings
- CHAOSS Education
- Linux Foundation Mentorship Programs
- Linux kernel Mentorship graduates blog about their journey
- CNCF celebrates successful mentees from LFX Program Term 1 2024!
- Congratulations to 45 CNCF Term 2 2024 LFX Program mentees!
- Blog | LF Decentralized Trust | Mentorship Program
- Hyperledger Mentorship – YouTube
- Unlock growth and talent: why maintainers should mentor with CNCF
- Behind the scenes of running Linux kernel Mentorship Programs
Related Fast Wonder blog posts:
- From Data to Action: Building Healthy and Sustainable Open Source Projects
- Contributor Sustainability Impacts Risk and Adoption of OSS Projects
- Using CHAOSS Practitioner Guides to Improve your OSS Projects
Photo by The Linux Foundation used under the CC BY-NC 4.0 license.


 As most of you know, I


 If you think you’ve seen this presentation before, you’re wrong! In the spirit of making sure that every talk at