Category Archives: community

Network Analysis and Community Visualizations

dawn_presentingAs usual, I’ve been neglecting my blog; however, you may notice that I finally did a little redesign using a modern template to make it more mobile-friendly and more accessible to avoid the Google search penalties. With this fresh new design, I decided that I needed something more recent than my last post in January.

So, I thought it would be nice to talk about my presentations from OSCON and the FLOSS Community Metrics Meeting in lovely Portland, OR in July.

If you want to skip my ramblings and get right to the content, you can find all of the code, data sets, instructions and links to the presentation materials on SlideShare by visiting my OSCON 2015 GitHub repository. UPDATE (Aug 23): The video for the OSCON portion is available now, too.

If you missed this presentation and want to see it live and in person, I’ll be doing similar talks at LinuxCon Seattle in August and LinuxCon Dublin in October. You might also be interested in reading the interview that Nicole Engard did with me on Opensource.com right before the conference to give me a chance to talk about my OSCON presentation and metrics in general.

What is Network Analysis?

The presentations both centered around network analysis, which studies relationships between units and looks for patterns and structure in those relationships. This is an oversimplified definition of network analysis, since it’s a fairly complicated discipline, so the best way to describe it is with a few examples of how people use network analysis.

  • My presentations looked at relationships and activity between people participating in an open source project.
  • It’s also used to study the relationships between organizations. Examples include looking at which companies have common people on their board of directors or to look at parent / subsidiary relationships between companies.
  • People are also using it to study animal social networks, like aggression and dominance between horses or food sharing between birds.
  • Someone at the University of Greenwich is doing historical social network analysis to look at the networks of people in medieval Scotland by using data from witness signatures on legal documents.
  • Friendship networks, work relationships, and other ways that people interact are also common examples of network analysis

MetricsGrimoire Tools

Metrics GrimoireThe MetricsGrimoire is the go-to set of tools that you’ll probably want to use to gather data from your open source community and store it into a database where you can write queries to extract the information you need. In these talks, I used mlstats data, but in my research, I also make heavy use of CVSAnalY. The OSCON 2015 GitHub repository README file has more instructions, but in short, you need to install mlstats, create the database, run mlstats on your mailing list to import the data into this new mlstats database, and finally use database queries to extract the data used for this presentation. You can also use my oscon.py script from the GitHub repository to extract the data.

Static Network Visualization

Dawn OSCON
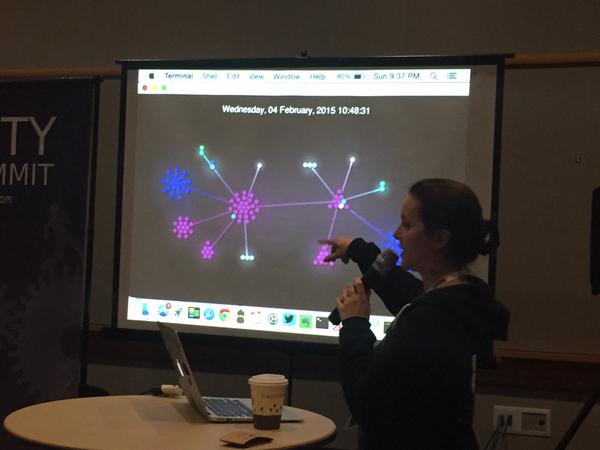
I took the output from the oscon.py script and used a combination of RStudio and Visone to visualize the data and create the network using data from one of the Linux kernel mailing lists (IOMMU) from January 2015 to keep the data set to a manageable size. In the end, we created a network diagram showing mailing list replies between people. The people with the most replies (degree centrality) are shown with larger circles (nodes), and the number of replies between any two people is shown by bolder or lighter arrows. Again, the OSCON 2015 GitHub repository README file has all of the details and instructions for how to do this, so I won’t duplicate it here.

Dynamic Visualization

Gource is a tool that most people use to easily visualize source code commits by each person for any repository; however, it can also be used with custom data. If you’ve never used Gource, you might want to take a brief detour and look at some of the many Gource visualizations on YouTube. I only had time in my OSCON talk to briefly cover Gource, but luckily, I was able spend 20 minutes on the topic during the FLOSS Community Metrics Meeting the weekend before OSCON. In the presentation, I showed how to create a custom log format file using mailing list data from mlstats and feed it into Gource for visualization. See the the OSCON 2015 GitHub repository README file for details about exactly how I did this.

What Else?

There are so many different tools available to do visualization of social network analysis. I used Visone because it runs on most major operating systems, and it’s fairly easy to get started with, but there are so many other options that you might want to play around with.

Python has quite a few packages that provide social network analysis, like NetworkX, for example. I haven’t had a chance to play with this much yet, but I know others who do quite a bit of their analysis using these tools, so they are on my list to try.

The final thing that I want to stress is that network analysis is so much more than just having cool graphs that allow you to look at your data. The visualizations are often the first step to see what might be happening in your network, but for those of us doing this type of work, it’s just the first step. The next steps usually involve many different calculations and measures to really understand what might be going on in the community. One example is how we changed the node size based on degree centrality for how many links that person had. It’s easy to explain, but it’s not a particularly sophisticated measurement of network centrality, and there are others that do a better job of looking at how well-connected people are to give you a better measure for influence. For example, if I regularly talk to 2 people within the Linux kernel, and if those people are Linus Torvalds and Greg K-H, I’m likely to be better connected within the network as a whole than if I’m talking to 10 other people with little or no influence.

If you are interested in my academic research, I also did a presentation recently at an academic conference here in the UK. That presentation and others can be found on my Academic page.

Photo credits

OSCON photo by Luis Cañas-Díaz and the FLOSS Metrics Gource photo by Stephen Walli.

Your Metrics Strategy at FLOSS Community Metrics

Cat measuring TapeI’m here in Brussels today for the FLOSS Community Metrics meeting, and I just gave a presentation about how to build Your Metrics Strategy. If you are interested, have a look at my presentation materials.

Talk description:

You probably know that community metrics are important, but how do you come up with a plan and figure out what you want to measure? Most open source projects have a very diverse community infrastructure with code repositories, IRC, mailing lists, wikis and other content sites, forums, and more. Deciding where to focus and what to measure across these many technologies can be a challenge.

What you measure can have a huge impact on behavior within the community, and you want to make sure that you are encouraging people to contribute in sane ways by measuring the activities that matter for your project.

In this presentation, I’ll talk about how you decide what to measure and give you examples of how I’ve done this at Puppet Labs and in other projects.

Photo credit: Sophie on Flickr

Lessons about Community from Science Fiction

everythingisfine-drwhoIf you think you’ve seen this presentation before, you’re wrong! In the spirit of making sure that every talk at Monki Gras is handcrafted and unique, I prepared a completely new set of slides and lessons just for Monki Gras.

While it is probably obvious from the title, this talk focuses on community tips told through science fiction. While the topic is fun and a little silly, the lessons about communities are real and tangible. Here are just a few of the things that I explored in this presentation:

  • Borg assimilation and bringing new community members into your collective for new ideas.
  • Specialization is for insects. The best community members are the ones who can help in a wide variety of ways.
  • Community members are valuable, don’t treat them like minions.
  • Travel to strange new worlds and meet interesting people

You can get the slides (with my speaker notes) on SlideShare.

Note: Comments are disabled on this post, since I’m tired of dealing with spam, but please ping me on Twitter, @geekygirldawn, or at the email address in the presentation if you have any questions.

The Puppet Community: Current State and Future Plans

Update September 4: The video of our presentation is now on YouTube.

Today at PuppetConf, Kara Sowles and I will be talking about the Puppet Community at 1:30pm in the French room. The session starts with a look at the Puppet community today. I use our community metrics to take a look at all kinds of data about pull requests, bugs, mailing lists, IRC and more. In addition to the numbers, I’ll also talk about some of our top contributors and our call for proposals for Puppet Camps, and Kara will talk about our Puppet User Groups (PUGs) and Triage-a-thon events. We also have much to do to make the community better, so we’ll talk about some plans for improvements that we’ll be making to the Puppet community. Throughout the presentation, we also include tips for how you can participate in the Puppet community.

I’ve uploaded the presentation along with speaker notes so that you can view or download the presentation now.

Community PuppetConf

Note: rather than dealing with spam, I’m closing comments on the post, but please feel free to reach out to us with questions or comments on Twitter or via email.

Open Source Community Metrics and State of the Puppet Community

Many of you probably know that I’ve spent the past week in Belgium for Puppet Camp Ghent and FOSDEM. I’ll be writing a blog post on the Puppet Labs blog later this week to talk about Puppet Camp Ghent, but I wanted to at least get my presentations out here while I finished writing the longer post.

Puppet Camp Ghent was amazing. I saw a few old friends and connected in person with quite a few community members that I had not yet met in person. Overall, I was very happy with the event, and the people at HoGent were great hosts. There were so many amazing presentations, and we’re getting them uploaded to the Puppet Camp page as soon as we get the slides from the speakers. Here is the presentation that I delivered on the State of the Puppet Community.

state-of-puppet-community

I had an amazing time at FOSDEM, too. I helped facilitate the Configuration / Systems Management DevRoom on Saturday along with a DevRoom dinner that evening. I love working in such a collaborative industry. The DevRoom and the dinner were organized collaboratively with our primary competitors, but we all worked together to pull it off in a way that benefited the industry. Aside from the DevRoom, I got to see a lot of old friends and had a great time!

At FOSDEM, I also gave a short version of my Open Source Community Metrics talk. If you are interested in open source metrics, you might rather look at the longer version that I presented at LinuxCon Barcelona in November. I also had a great conversation from Jesus at Bitgeria, and they are doing some awesome stuff with open source community metrics that you should look at if you are interested in metrics.

Next on my agenda are trips to Stockholm, Sweden and Oslo, Norway for two more Puppet Camps in the next two weeks before heading back home to Portland.

Lurking and Learning as a New Community Manager

LurkingI started working at Puppet Labs during the last week of September. During the interview process and in the first few weeks, I made sure people knew that I would spend my first month or two lurking in the community while I learned about how people participate in this community. I’ve been working with open source and communities for more than a decade, but this is still an essential step when you are new to a community as a community manager*.

I’ve seen too many over-eager new community managers jump into the community early and make mistakes by violating community norms, talking about things that aren’t relevant, making people unnecessarily upset, and just generally making a mess of things. Every community manager makes mistakes at some point, but here I’m talking about the issues that could have been avoided by knowing more about the community before jumping in with both feet.

Don’t be afraid to let other people do most of the responding while you learn from them. By taking the time to observe and lurk for a bit, you can learn about how people behave and get a feel for how people typically respond.

This doesn’t mean that I spent my first month sitting on my butt. As part of the learning process, I spent a lot of time talking to other employees about what works well in the community and about what isn’t working. As a part of talking about the things that weren’t working, I focused on what was causing the most pain for our engineers and started thinking about how we could make things better. I came up with a big list of things to tackle and started talking to people about plans for improving some of the community processes that were the most painful. I’ve started working on a few of these already, and others are in my 2013 plans.

I also worked on a lot of documentation and improvements to website content during this first month. We really didn’t have community guidelines or other standard documentation. Since community guidelines are relatively similar for many open source projects, I got a good start on those in the first month. I also focused on getting monthly community metrics published. I actually got a ton of work done during my first months. It just wasn’t publicly visible work.

Don’t be afraid to work behind the scenes for your first month or two while you learn about the community. If you make sure that your manager and colleagues know why you aren’t publicly visible while making sure that your work behind the scenes benefits the company, people are more likely to see it as an important and necessary part of the process of starting this new job.

Additional Reading:

*If you were hired out of a community where you have already been participating or are hired to work on a newly launched community, this advice probably doesn’t apply to you.

Photo by Stephen Jones used under a Creative Commons license.


Open Source Community Metrics: LinuxCon Barcelona

I wanted to share the presentation that I will be giving today at LinuxCon Barcelona at 1:20pm, Open Source Community Metrics: Tips and Techniques for Measuring Participation. This is similar to the presentation that I gave a few weeks ago at the LibreOffice Conference in Berlin, but I have added some new data and included different examples. You might also be interested in seeing the Puppet Community Metrics that I recently started posting on the Puppet Labs website.

You can download the presentation from SlideShare.

Talk Abstract:

Do you know what people are really doing in your open source project? Having good community data and metrics for your open source project is a great way to understand what works and what needs improvement over time, and metrics can also be a nice way to highlight contributions from key project members. This session will focus on tips and techniques for collecting and analyzing metrics from tools commonly used by open source projects. It’s like people watching, but with data.

The best thing about open source projects is that you have all of your community data in the public at your fingertips. You just need to know how to gather the data about your open source community so that you can hack it all together to get something interesting that you can really use. This session will be useful for anyone wanting to learn more about the communities they manage or participate in.

LibreOffice Conference: Open Source Metrics

Today at the LibreOffice Conference in Berlin, I will be presenting a session titled, “Open Source Community Metrics: Tips and Techniques for Measuring Participation.” It has tools, techniques and examples of metrics from the LibreOffice project, Puppet and MeeGo to illustrate several ways to gather and interpret the metrics for your open source project.

If you are interested in watching the presentation, it will be on the LibreOffice Conference live stream starting at 18:00 CEST in Berlin or 9am Pacific time.

You can also download a copy of the presentation from SlideShare.

Talk Abstract

Do you know what people are really doing in your open source project? Having good community data and metrics for your open source project is a great way to understand what works and what needs improvement over time, and metrics can also be a nice way to highlight contributions from key project members. This session will focus on tips and techniques for collecting and analyzing metrics from tools commonly used by open source projects. It’s like people watching, but with data.

The best thing about open source projects is that you have all of your community data in the public at your fingertips. You just need to know how to gather the data about your open source community so that you can hack it all together to get something interesting that you can really use. We’ll start with some general guidance for coming up with a set of metrics that makes sense for your project and talk about the LibreOffice community metrics. The focus of the session will be on tips and techniques for collecting metrics from tools commonly used by open source projects: Bugzilla, MediaWiki, Mailman, IRC and more. It will include both general approaches and technical details about using various data collection tools, like mlstats. The final section of the presentation will talk about techniques for sharing this data with your community and highlighting contributions from key community members. For anyone who loves playing with data as much as I do, metrics can be a fun way to see what your community members are really doing in your open source project.

Companies and Communities Book Sale

I published the book, Companies and Communities: Participating without being sleazy, in March 2009. For some reason, people are still buying it, despite it’s increasing age! I just paged through it, and while a few sections have information that just isn’t relevant now, there is still some good stuff in it. However, there is enough outdated content that I just can’t justify the original price tag, so I decided to permanently reduce the price while I decide if I want to take the time to update and revise it for a second edition.

Here are the newly reduced prices

  • Paperback book is available for $9.99.
  • Kindle version from Amazon for $4.99.
  • Buy the PDF eBook for $6.99.

Now, here’s the question. Would people be interested in a second edition of the book with updated content? I learned a lot about book formatting by doing this book and my more recent cookbook, so I know I could put together a more polished version. I could also add new content and the quick tips from my community manager tips series.

Crunching the numbers: Open Source Community Metrics at OSCON

Dave Neary and I co-presented a session about metrics at OSCON on Wednesday based on what we have learned so far from doing the MeeGo metrics.

Description

Every community manager knows that community metrics are important, but how do you come up with a plan and figure out what you want to measure? Most community managers have their own set of hacky scripts for extracting data from various sources after they decide what metrics to track. There is no standardized Community Software Dashboard you can use to generate near-real-time stats on your community growth.

Like most open source projects, we have diverse community infrastructure for MeeGo, including Mailman, Drupal, Mediawiki, IRC, git, OpenSuse Build Service, Transifex and vBulletin. We wanted to unify these sources together, extract meaningful statistics from the data we had available to us, and present it to the user in a way that made it easy to see if the community was developing nicely or not.

Building on the work of Pentaho, Talend, MLStats, gitdm and a host of others, we built a generic and open source community dashboard for the MeeGo project, and integrated it into the website. The project was run in the open at on the MeeGo wiki and all products of the project are available for reuse.

This presentation covered the various metrics we wanted to measure, how we extracted the data from a diverse set of services to do it, and more importantly, how you can do it too.