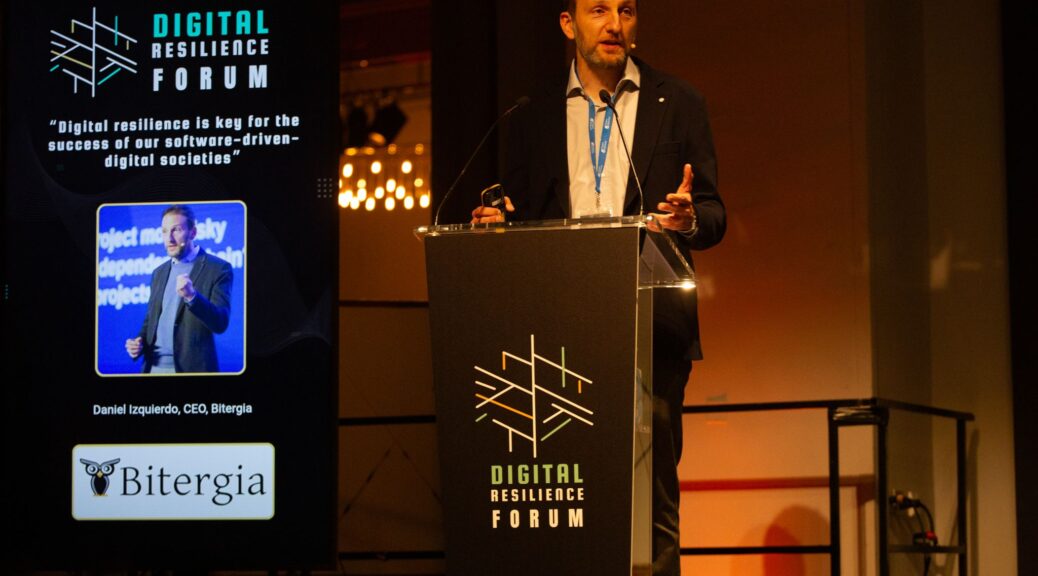
Tag Archives: open source

From Data to Action: Building Healthy and Sustainable Open Source Projects

Hands holding dirt with a small green flower growing out of it.

Last week, I had an article published in Computer magazine, an IEEE publication: From Data to Action: Building Healthy and Sustainable Open Source Projects (the PDF version is in an easy to read format). One of the primary ways that the CHAOSS project is helping people improve the health and sustainability of their open source projects is via the Practitioner Guide series, which I covered in more detail in the Computer article.

On a related note, we’ve published two new Practitioner Guides this week: Getting Started with Sunsetting an Open Source Project and Getting Started with Building Diverse Leadership! These new guides complement the previously released guides that I talked about in a recent blog post. The rest of this post has a few more details about the Computer magazine article and the two new guides.

In the Computer magazine article, I talked about how the CHAOSS project is providing advice and resources for proactively using metrics to improve open source project health and sustainability before a crisis occurs to make software more sustainable and reliable for everyone. Here’s a short quote from the Computer magazine article:

“Building sustainable open source projects over the long term can be a challenge. Project leaders, maintainers, and contributors are busy people who don’t always have the time to focus on growing a community along with maintaining their software. Using metrics is one way to help identify potential issues and areas where a project can be improved to make it more sustainable over the long term. Metrics are best used if they aren’t used once and never again. By monitoring the data over time, projects can understand trends that might indicate areas for improvement as well as see if those improvements are having the desired effect. Being proactive about improving sustainability before it becomes a crisis can help make open source software more sustainable and reliable for everyone” – Read the rest of the IEEE Computer magazine article for more.

The newest guide in the series, Practitioner Guide: Getting Started with Building Diverse Leadership, was written by Peculiar C. Umeh. It expands on the theme of improving health and sustainability of open source projects by creating a welcoming and inclusive environment that encourages contributions from a wide variety of people. Here’s a quote from the guide:

“A community or project with diverse leadership offers significant advantages because diverse leadership leverages diverse perspectives to build an innovative community, create a welcoming and inclusive environment, and empower individuals from all backgrounds to contribute their unique talents. New and existing contributors feel more included when they can see other people in leadership positions who are like them (Linux Foundation, 2021). When diverse leaders collaborate, their intersection sparks innovation and creates a more harmonious global leadership system. It represents a global and diverse user base, which improves the usability of the project because more users’ voices are represented in decision-making about the project’s design and functionality. It enhances decision-making processes by incorporating various viewpoints and experiences, leading to better problem-solving and more effective strategies. It promotes a culture of inclusion and respect, improving morale and engagement among community members and ultimately contributing to projects’ long-term success and sustainability.” – Read the Practitioner Guide: Getting Started with Building Diverse Leadership for more.

The other new guide in the series, Practitioner Guide: Getting Started with Sunsetting an Open Source Project, is also about making open source more sustainable by being clear about the future of an open source project so that users can make responsible decisions and avoid using open source technologies that are no longer being maintained or updated with security fixes. Here’s a quote from the guide:

“Many open source projects, even widely used ones, become abandoned for a variety of reasons (e.g., evolving interests, family situations, employment changes), but abandonment can be done in a responsible way by proactively sunsetting the project (Miller et al. 2025). Sunsetting is an important consideration for corporate environments where it can be easy to lose track of projects that were created by employees who later walked away from the project and left if abandoned. You don’t want abandoned open source projects with security vulnerabilities sitting in your organization’s source code repositories where someone might trust that project simply because they trust your organization. Finding inactive projects and responsibly sunsetting them is a good business decision and something that many open source teams / Open Source Program Offices (OSPOs) do on a regular basis. It’s important to remember that not every open source project can or should exist forever: technologies evolve, corporate priorities change, and people’s interests change. Part of the beauty of open source is that we work in the open as we innovate, and some of those innovative projects will stand the test of time, while others should be responsibly deprecated via a sunset process. Sunsetting an open source project should take your user’s needs into account, and where possible, offer users time to migrate to a replacement technology. At a minimum, it’s important to signal that the project will no longer be maintained, updated, or have security patches so that users know that they should no longer be using the project.” – Read the Practitioner Guide: Getting Started with Sunsetting an Open Source Project for more.

As always, these CHAOSS guides are under an open source license, so you’re free to use and modify them to meet your needs.

Photo by Jennifer Delmarre on Unsplash.

New Power Dynamics in Open Source: Rug Pulls, Relicensing, and Forks

I’ve spent a lot of time over the past year doing research into open source projects that have moved to proprietary licenses and the forks that were the result of those license changes. More recently (starting with a talk at Monki Gras), I’ve been thinking about how the power dynamics within the open source ecosystem have evolved and how rug pulls, relicensing, and forks can shift those power dynamics.

I finally wrote all of this down and turned it into a blog post for The New Stack: Clouds, Code, and Control: The New Open Source Power Struggle. Here’s a short quote from the post:

“With the rise in popularity of large cloud providers, the open source power dynamics are looking kind of similar to the feudalism example I talked about at the beginning of this blog post, but in the open source case, what’s different is that we have ways to shift or flip the power dynamics. A smaller company deciding to move a project away from an open source license can flip the power dynamic and gain power back from those large cloud providers. Still, they also shift the balance of power even further away from contributors and users at the same time when they decide to relicense that project. This encourages those with less power to take collective action to fork a project, flipping the power dynamic in favor of the contributors and users, often including the cloud providers as users. Within the open source world, we are better off than the peasants and serfs because we have certain freedoms that allow us to take collective action to regain power by forking projects when others abuse their power.” – read the rest of the blog post on The New Stack.

If you want to learn more about the research, here are a few places to get started:

Photo by Lance Reis on Unsplash

Using CHAOSS Practitioner Guides to Improve your OSS Projects

Within the CHAOSS project, we know that people often struggle to make productive use of the tsunami of data about open source projects. One of my focus areas over the past 2 years within the CHAOSS project has been to develop a series of Practitioner Guides designed to help develop insights that can be used to improve the project health of an open source project. So far, we have 5 guides: Introduction, Contributor Sustainability, Responsiveness, Organizational Participation, and Security with more guides coming soon.

I’ve written about these guides in an OpenSource.net blog post and recorded a CHAOSScast podcast about each guide. I’ve also done quite a few talks related to the topics in these guides, which can be found on my Speaking page. The most recent one was a joint talk with Peculiar C. Umeh at FOSS Backstage with a video that is available to watch.

I won’t go into more detail here, since I’ve already linked to other blog posts, podcasts, and talks on the topic, but I encourage you to have a look at the Practitioner Guides to find ways to make your open source projects healthier and more sustainable!

Speaking, Blogging, and More

It’s time again for my regularly scheduled (once every year and a half) blog post to avoid completely neglecting my personal blog. While I don’t blog often, I do still update my Speaking page on a regular basis, and conferences have really ramped up over the past couple of months! I’ll admit to being really tired of attending boring virtual events, so when the in-person events started back up, I went to all of them! In my rush of excitement about traveling and seeing people again, I agreed to do way too many talks – 10 talks in two months. Here are a few of the topics I’ve been talking about over the past year and a half, and you can visit my Speaking page to get links to slides and videos where available:

  • Navigating and mitigating open source project risk
  • Good governance practices for open source projects
  • Metrics and measuring project health
  • Becoming a speaker and getting talks accepted at conferences
  • Being a good corporate citizen in open source

I’ve also written quite a few blog posts on the VMware Open Source Blog and elsewhere on similar topics:

I’ve also been a guest on a few podcasts: Open Source for Business, a Brandeis webinar on Open Source and Education, Community Signal, and The New Stack. You can also find me as an occasional host for various metrics topics on episodes of the CHAOSScast podcast.

As part of my work on the OpenUK board, I was interviewed for a featured section about Open Source Program Offices in the report, State of Open: The UK in 2021 Phase Two: UK Adoption where I talked about VMware’s OSPO.

On a more personal note, we’ve been doing really well throughout the pandemic. We finally had our first real vacation in Malta, where we relaxed while eating and drinking our way through Malta along with swimming, snorkeling, reading, and enjoying the sunshine. I still keep an updated list of every book I read here on my blog if you’d like to know what I’ve been reading.

Since I don’t post here often, if you want to keep up with what I’ve been doing, I post more frequently on Twitter.

VMware and Other Updates

I realized that I haven’t posted anything in over a year and a half here, but I’ve definitely been busy! The biggest change is that Pivotal was acquired by VMware a few months ago, and I have moved into the Open Source Program Office as Director of Open Source Community Strategy where I continue to work remotely from my flat in the UK. I love my new job, and I get to work with a bunch of really amazing people! While I haven’t been blogging here, I have written several blog posts on the VMware Open Source Blog about building community and strategy.

I’ve been doing quite a few talks at conferences and other events, including some virtual ones, on a wide variety of topics including community building, open source metrics, Kubernetes, and more. Links to presentations and videos where available can be found on the speaking page.

I’m one of the rotating hosts for the new CHAOSScast podcast where we chat about a wide variety of open source metrics topics. I also wrote a post on the CHAOSS blog with a video that talks about how I’m using metrics at VMware to learn more about the health of our open source projects. If you’re as passionate about data and metrics as I am, CHAOSS is an open source community that welcomes contributors of all types, and it’s a fun group of people, so you should join us!

I’ve joined the OpenUK Board of Directors to help promote collaboration around open technologies (open source, open hardware, and open data) throughout the UK. We have weekly presentations that are free for anyone to attend every Friday, and we’re always looking for volunteers who want to help out on a wide variety of committees.

There are also a few other miscellaneous things that I’ve done recently:

I hope to see all of you around the internet, and maybe we’ll even be able to catch up in person after this silly pandemic is over!

Extracting Data from Open Source Communities

On Sunday at FOSDEM, I have a 5 minute lightning talk about extracting data from open source communities in the HPC, Big Data, Data Science devroom (slides).

Open source communities are filled with huge amounts of data just waiting to be analyzed. Getting this data into a format that can be easily used for analysis may seem intimidating at first, but there are some very useful open source tools that make this task relatively easy.

Metrics GrimoireThe primary tools used in this talk are the open source Metrics Grimoire tools that take data from various community sources and store it in a database where it can be easily queried and analyzed.

Tools covered:

  • CVSAnalY to gather and analyze source code repository data
  • MLStats to gather and analyze mailing list data
  • Other Metrics Grimoire tools for bug trackers, IRC, Wikis and more
  • Gource to visualize source code repository data

MLStats and CVSAnaly – Installation and data import:

It’s very easy to get started with MLStats and CVSAnaly and use them to import data from your mailing lists and code repositories.

  1. Install
  2. $ python setup.py install

  3. Create database
  4. mysql> create database mlstats;
    
mysql> create database cvsanaly;

  5. Import data
  6. $ mlstats http://URLOFYOURLIST
    
$ cvsanaly2 /path/to/repo

MLStats – Queries to extract data:

  • Top 100 messages (most replied to threads):
  • SELECT subject, COUNT(*) as total 
FROM messages 
GROUP BY subject 
ORDER by total DESC 
LIMIT 100;

  • Other queries:

    • # of messages from a specific person

    • # of messages per person from email domain


    • Find all messages with specific word in subject line (patch)

    • More queries

CVSAnalY – Queries to extract data:

  • Number of commits per person by email domain:
  • SELECT p.name, p.email, 
COUNT(distinct(s.id)) as num_commits 
FROM people p, scmlog s 
WHERE email like "%company.com" 
AND p.id=s.author_id 
GROUP BY email 
ORDER BY num_commits DESC;

  • Other queries:

    • Top commit authors all time

    • # of commits for specific person
    • More Queries

Other Metrics Grimoire Tools:

Gource:

Gource is an amazing tool to visualize activity from your source code repositories. I did a full talk about Gource on Friday at the FLOSS Community Metrics meeting, so have a look at that blog post for details about using Gource.

Using Gource to Visualize Your Repositories

Today at the FLOSS Community Metrics meeting in Brussels, Belgium, I gave a short, 5-minute lightning talk about using Gource to visualize your source code repositories with a focus on navigating the myriad of Gource configuration options and how to tweak them to make Gource work better for your repository. In this blog post, I’ll give an overview of the talk, but for all of the details or to replicate the demo, you should have a look at the GitHub repository for the talk.

In the talk, I did a visualization of the MailingListStats (mlstats) repository from the Metrics Grimoire suite of tools, and here is the video generated using these options:

gource -f --logo images/bitergia_logo_sm.png --title "MailingListStats AKA mlstats" --key --start-date '2014-01-01' --user-image-dir images -a 1 -s .05 --path ../MailingListStats

Option Details:

  • --path /path/to/repo (or omit and run Gource from the top level of the repo dir)
  • -f show full screen
  • --logo images/bitergia_logo_sm.png
  • --title "MailingListStats AKA mlstats"
  • --key (shows color key for file types)
  • --start-date '2014-05-01'
  • --user-image-dir images (Directory with .jpg or .png images of users ‘Full Name.png’ for avatars)
  • -a 1 (auto skip to next entry if nothing happens in x seconds – default 3)
  • -s .05 (speed in seconds per day – default 10)

You can also manipulate the video while Gource is running:

  • Space bar to pause
  • Ctrl + / – to speed up or slow down
  • Use arrow keys to move camera
  • Mouse over timeline widget at the bottom and click on a date to move in time.

For additional information:

Consulting Again

Scale FactoryAs most of you know, I moved to London to start working toward a PhD last January. Now that I’m off to a good start on the PhD, I find that I actually miss working, so I’m going to start consulting again.

I’ll be working part-time at The Scale Factory here in London. I’m interested in doing consulting projects related to building communities, open source, data analysis, etc. You can find all of the details on my consulting page. I’m also open to doing other types of projects.

If you are interested in getting my help for any of your projects, please email me: dawn@scalefactory.com.

Network Analysis and Community Visualizations

dawn_presentingAs usual, I’ve been neglecting my blog; however, you may notice that I finally did a little redesign using a modern template to make it more mobile-friendly and more accessible to avoid the Google search penalties. With this fresh new design, I decided that I needed something more recent than my last post in January.

So, I thought it would be nice to talk about my presentations from OSCON and the FLOSS Community Metrics Meeting in lovely Portland, OR in July.

If you want to skip my ramblings and get right to the content, you can find all of the code, data sets, instructions and links to the presentation materials on SlideShare by visiting my OSCON 2015 GitHub repository. UPDATE (Aug 23): The video for the OSCON portion is available now, too.

If you missed this presentation and want to see it live and in person, I’ll be doing similar talks at LinuxCon Seattle in August and LinuxCon Dublin in October. You might also be interested in reading the interview that Nicole Engard did with me on Opensource.com right before the conference to give me a chance to talk about my OSCON presentation and metrics in general.

What is Network Analysis?

The presentations both centered around network analysis, which studies relationships between units and looks for patterns and structure in those relationships. This is an oversimplified definition of network analysis, since it’s a fairly complicated discipline, so the best way to describe it is with a few examples of how people use network analysis.

  • My presentations looked at relationships and activity between people participating in an open source project.
  • It’s also used to study the relationships between organizations. Examples include looking at which companies have common people on their board of directors or to look at parent / subsidiary relationships between companies.
  • People are also using it to study animal social networks, like aggression and dominance between horses or food sharing between birds.
  • Someone at the University of Greenwich is doing historical social network analysis to look at the networks of people in medieval Scotland by using data from witness signatures on legal documents.
  • Friendship networks, work relationships, and other ways that people interact are also common examples of network analysis

MetricsGrimoire Tools

Metrics GrimoireThe MetricsGrimoire is the go-to set of tools that you’ll probably want to use to gather data from your open source community and store it into a database where you can write queries to extract the information you need. In these talks, I used mlstats data, but in my research, I also make heavy use of CVSAnalY. The OSCON 2015 GitHub repository README file has more instructions, but in short, you need to install mlstats, create the database, run mlstats on your mailing list to import the data into this new mlstats database, and finally use database queries to extract the data used for this presentation. You can also use my oscon.py script from the GitHub repository to extract the data.

Static Network Visualization

Dawn OSCONI took the output from the oscon.py script and used a combination of RStudio and Visone to visualize the data and create the network using data from one of the Linux kernel mailing lists (IOMMU) from January 2015 to keep the data set to a manageable size. In the end, we created a network diagram showing mailing list replies between people. The people with the most replies (degree centrality) are shown with larger circles (nodes), and the number of replies between any two people is shown by bolder or lighter arrows. Again, the OSCON 2015 GitHub repository README file has all of the details and instructions for how to do this, so I won’t duplicate it here.

Dynamic Visualization

Gource is a tool that most people use to easily visualize source code commits by each person for any repository; however, it can also be used with custom data. If you’ve never used Gource, you might want to take a brief detour and look at some of the many Gource visualizations on YouTube. I only had time in my OSCON talk to briefly cover Gource, but luckily, I was able spend 20 minutes on the topic during the FLOSS Community Metrics Meeting the weekend before OSCON. In the presentation, I showed how to create a custom log format file using mailing list data from mlstats and feed it into Gource for visualization. See the the OSCON 2015 GitHub repository README file for details about exactly how I did this.

What Else?

There are so many different tools available to do visualization of social network analysis. I used Visone because it runs on most major operating systems, and it’s fairly easy to get started with, but there are so many other options that you might want to play around with.

Python has quite a few packages that provide social network analysis, like NetworkX, for example. I haven’t had a chance to play with this much yet, but I know others who do quite a bit of their analysis using these tools, so they are on my list to try.

The final thing that I want to stress is that network analysis is so much more than just having cool graphs that allow you to look at your data. The visualizations are often the first step to see what might be happening in your network, but for those of us doing this type of work, it’s just the first step. The next steps usually involve many different calculations and measures to really understand what might be going on in the community. One example is how we changed the node size based on degree centrality for how many links that person had. It’s easy to explain, but it’s not a particularly sophisticated measurement of network centrality, and there are others that do a better job of looking at how well-connected people are to give you a better measure for influence. For example, if I regularly talk to 2 people within the Linux kernel, and if those people are Linus Torvalds and Greg K-H, I’m likely to be better connected within the network as a whole than if I’m talking to 10 other people with little or no influence.

If you are interested in my academic research, I also did a presentation recently at an academic conference here in the UK. That presentation and others can be found on my Academic page.

Photo credits

OSCON photo by Luis Cañas-Díaz and the FLOSS Metrics Gource photo by Stephen Walli.

Your Metrics Strategy at FLOSS Community Metrics

Cat measuring TapeI’m here in Brussels today for the FLOSS Community Metrics meeting, and I just gave a presentation about how to build Your Metrics Strategy. If you are interested, have a look at my presentation materials.

Talk description:

You probably know that community metrics are important, but how do you come up with a plan and figure out what you want to measure? Most open source projects have a very diverse community infrastructure with code repositories, IRC, mailing lists, wikis and other content sites, forums, and more. Deciding where to focus and what to measure across these many technologies can be a challenge.

What you measure can have a huge impact on behavior within the community, and you want to make sure that you are encouraging people to contribute in sane ways by measuring the activities that matter for your project.

In this presentation, I’ll talk about how you decide what to measure and give you examples of how I’ve done this at Puppet Labs and in other projects.

Photo credit: Sophie on Flickr